|
|

|
Level 2 Tool
No data is shared:
Access to this tool does not require any user to share information about themselves
|
Grades:
Intermediate
Middle
High
|

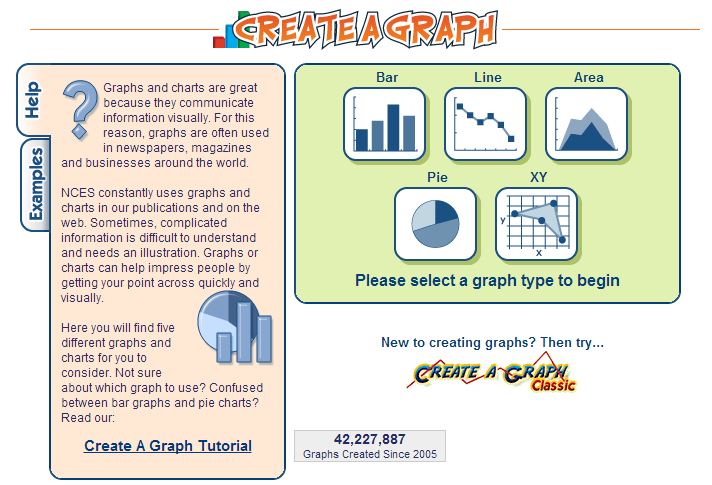
Create a graph is data management tool which allows users to create any of five different graphs available. These graphs are created quickly and easily by imputing information in order to communicate their data visually.

The five types are bar, lne, area, pie, and xy graphs

Downloadable directions for creating each type of graph
Two minute silent video tutorial showing how to input data

- Excellent way for students to explore data analysis in or out of a math class
- Can be used by teachers to easily display classroom data
- Have students collect data and generate their own graphs
- Generate graphs from data sets and have students answer questions based on the graph
- Display classroom data
- Can be used in science as well as math, students can depict data using a pie chart
- Have students compare and contrast the size of different fractions using a pie graph
- Use real pies to create fractions
- Students can interview each other on a specific topic and then graph the results
- While participating in a science fair, students can use this program to graph their data
|
Substitution
|
Augmentation
|
Modification
|
Redefinition |
|
Provide multiple means of
Representation (Content)
|
|
|
Display the same set of data using different types of graphs. |
|
|
Provide multiple means of
Action and Expression (Product)
|
|
Create a graph to display data from a class poll. |
|
|
|
Provide multiple means of
Engagement (Process)
|
|
Students create graphs to track their progress and reflect on their performance. |
|
|
Comments (0)
You don't have permission to comment on this page.